Andrew Simon, curator of the Biodiversity Galiano project, has been working with the UK’s Antranig Basman to develop a visual representation of the Galiano bioblitz results. Antranig is an associate with Raising the Floor initiative.
Andrew and Antranig came up with what they call the “bagatelle” or “sunburst” representation of Galiano species. They kindly assisted the Metchosin Biodiversity Project to adapt their own database to this unique visualization.
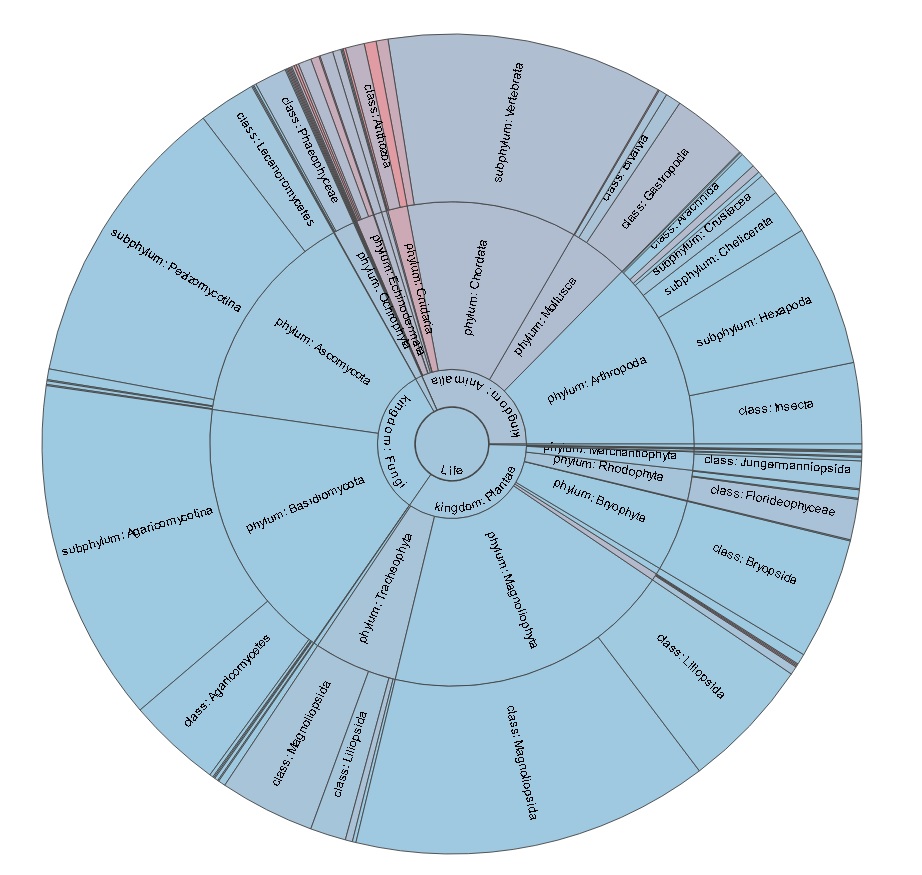
To see how the sunburst for Metchosin species works, click on the image of the sunburst. By starting at the middle of the circle and clicking your way to the outside, you will gradually see more and more restricted taxa of species. At the end of the migration to the periphery of the circle, you will find specific species. Hovering the mouse over these shows a species observation from our database.
All observations from our 2011 and later BioBlitzes and MycoBlitzes are represented in blue. Observations from pre-bioblitz lists are in a shade of red. Taxa that contain both types of observations are in a mixed shade that represents the proportion of each type of observation.
Currently, about 85% of our BioBlitz and pre-BioBlitz species discoveries are represented in the sunburst.